Showing posts with label NASA. Show all posts

Wednesday, September 16, 2009

In Search of Ninja Asteroids

We are living through a glorious age of exploration of our solar system. This particular tool will begin the task of ferreting out a proper map of all significant objects in nearby solar orbit.

Obviously we expect to find a lot of material that is worth tracking.

I am not nearly so exercised over possible impacts as some because our efforts have shown us that these events are super rare and most everything is nicely managed by Jupiter.

It is most likely the reason that Venus does not have a supply of water yet. Mankind’s future task will be to change that, after we are properly finished here. Then we will have two planets to live on comfortably.

I am pleased that this protocol will work. I would certainly have expected problems there.

The next big push, once we have a source of energy such as the focus fusion device, will be to spread a number of such scopes out into the solar system to form a large globe based initially on Earth’s orbit and naturally able to collect data on the inner solar system inside the orbit of Jupiter.

This all will be much sooner than anyone thinks. We have the technology and we have the teams in place to make it happen. It is all waiting for the necessary fusion powered one g thruster. As is also our first manned trip to Mars. Without a one g thruster, exploring Mars with a thousand rovers looks like a wonderful idea and certainly many times more effective.

In Search of Dark Asteroids (and Other Sneaky Things) 09.15.2009

In modern warfare, though, ninjas would be sitting ducks. Their black clothes may be hard to see at night with the naked eye, but their warm bodies would be clearly visible to a soldier wearing infrared goggles.

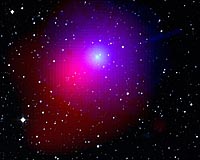
To hunt for the "ninjas" of the cosmos — dim objects that lurk in the vast dark spaces between planets and stars — scientists are building by far the most sensitive set of wide-angle infrared goggles ever, a space telescope called the Widefield Infrared Survey Explorer (WISE).

WISE will scan the entire sky at infrared wavelengths, creating the most comprehensive catalog yet of dark and dim objects in the cosmos: vast dust clouds, brown dwarf stars, asteroids — even large, nearby asteroids that might pose a threat to Earth.

Surveys of nearby asteroids based on visible-light telescopes could be skewed toward asteroids with more-reflective surfaces. "If there's a significant population of asteroids nearby that are very dark, they will have been missed by these previous surveys," says Edward Wright, principal investigator for WISE and a physicist at the University of California in Los Angeles.

The full-sky infrared map produced by WISE will reveal even these darker asteroids, mapping the locations and sizes of roughly 200,000 asteroids and giving scientists a clearer idea of how many large and potentially dangerous asteroids are nearby. WISE will also help answer questions about the formation of stars and the evolution and structure of galaxies, including our own Milky Way.

And the discoveries won't likely stop there.

"When you look at the sky with new sensitivity and a new wavelength band, like WISE is going to do, you're going to find new things that you didn't know were out there," Wright says.

Stars emit visible light in part because they're so hot. But cooler objects like asteroids emit light too, just at longer, infrared wavelengths that are invisible to the unaided eye. In fact, any object warmer than absolute zero will emit at least some infrared light.

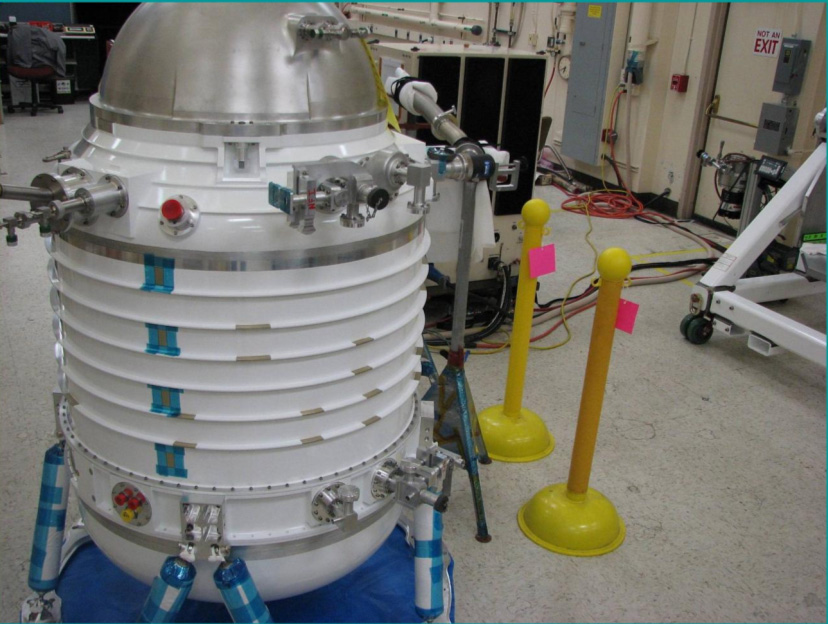
Unfortunately, this fact makes building an infrared telescope rather difficult. Without a coolant, the telescope itself would glow in infrared light just like all other warm objects do. It would be like building a normal, visible-light telescope out of Times Square billboard lights: The telescope would be blinded by its own glow.

To solve this problem, WISE will cool its components to about 15°C above absolute zero (or -258°C) using a block of solid hydrogen. Mission scientists chose solid hydrogen over liquid helium, which is often used in research for cooling materials to near absolute zero, because a smaller volume of solid hydrogen can do the job. "The cooling power is much higher for hydrogen than for helium," Wright explains. When launching a telescope into space, being smaller and lighter saves money.

Previous space telescopes such as the Infrared Astronomical Satellite (IRAS) have mapped the sky at infrared wavelengths before, but WISE will be hundreds of times more sensitive. While other missions could only see diffuse sources of infrared light such as large dust clouds, WISE will be able to see asteroids and other point sources.

After it launches into orbit as early as this December, WISE will spend 6 months mapping the sky, during which it will download its data to ground stations 4 times each day. Analyzing that data should give scientists some new insights into the cosmos.

For example, one theory posits that most of the stars in the Universe were formed in the press of colliding galaxies. When galaxies collide, interstellar clouds of gas and dust smash together, compressing the clouds and starting a self-perpetuating cycle of gravitational collapse. The result is a flurry of starbirth. Newborn stars are usually concealed by the dusty clouds they are born in. Ordinary light cannot escape, but infrared light can.

WISE will be able to detect infrared emissions from the most active star-forming regions. This will help scientists know how rapidly stars are formed during galactic collisions, which could indicate how many of the universe's stars were formed this way.
'
WISE will also target dim "failed stars" called brown dwarfs that outnumber ordinary stars by a wide margin. Mapping brown dwarfs in the Milky Way may reveal much about the structure and evolution of our own galaxy.

And this could be just the beginning of the discoveries scientists make once WISE puts the spotlight on stealthy denizens of the dark.

Thursday, September 10, 2009

Hubble Begins Second Life


This latest from the Hubble is the first set of images post refurbishment and they tell us that it is better than ever. So we will continue to get great images from this source.

Other important scopes are also now operating here on earth and we are getting hugely improved resolution there also.

I suspect that someone is going to establish a system down in the deep Antarctic to take advantage of the exceptional viewing conditions there. It may actually provide a reason to build a haulage road to the Polar Regions. It will be a challenge to develop equipment able to operate there but it will he well worth it.

At least we see the opportunity and can check it out.

Anyway the final link will take you to a Gallery of new images. This is a great time to visit the Hubble site and to refresh yourself on their accomplishments. It likely has been the most important contributor to pure science in the past two decades and has encouraged an expansion of scopes and astronomers to put many more eyes to work.


Spectacular First Images from the Rejuvenated Hubble Space Telescope

September 9, 2009: Astronomers have declared NASA's Hubble Space Telescope a fully rejuvenated observatory with the release of observations from four of its six operating science instruments. Sen. Barbara Mikulski of Maryland unveiled the images today at NASA Headquarters in Washington, DC.

"This marks a new beginning for Hubble," said Ed Weiler, associate administrator for NASA's Science Mission Directorate. "The telescope was given an extreme makeover and now is significantly more powerful than ever, well-equipped to last into the next decade."

Topping the list of new views are colorful, multi-wavelength pictures of far-flung galaxies, a densely packed star cluster, an eerie "pillar of creation," and a "butterfly" nebula. Hubble's suite of new instruments allows it to study the universe across a wide swath of the light spectrum, from ultraviolet all the way to near-infrared. In addition, scientists released spectroscopic observations that slice across billions of light-years to probe the cosmic-web structure of the universe and map the distribution of elements that are fundamental to life as we know it.

"I fought for the Hubble repair mission because Hubble is the people's telescope," said Mikulski, chairwoman of the Commerce, Justice and Science Appropriations Subcommittee that funds NASA. "I also fought for Hubble because it constantly rewrites the science textbooks. It has more discoveries than any other science mission. Hubble is our greatest example of our astronauts working together with scientists to show American leadership and ingenuity."

"I want to salute Team Hubble -- everyone who worked on Hubble from the Goddard Space Flight Center and Space Telescope Science Institute scientists in Maryland, to the ground crew at the Kennedy Space Center, to the Johnson Space Center where the astronauts train, and to the astronauts who were heroes in space," she concluded.

The new instruments are more sensitive to light and, therefore, will improve Hubble's observing efficiency significantly. It is able to complete observations in a fraction of the time that was needed with prior generations of Hubble instruments. The space observatory today is significantly more powerful than it ever has been.

http://hubblesite.org/newscenter/archive/releases/2009/25/image/ac/


Above: A sample spectrum obtained by Hubble's new Cosmic Origins Spectrograph (COS). More examples of COS data may be found here and here.

The new results are compelling evidence of the success of the STS-125 servicing mission in May, which has brought the space observatory to the apex of its scientific performance. Two new instruments, the Wide Field Camera 3 and Cosmic Origins Spectrograph, were installed, and two others, the Advanced Camera for Surveys and Space Telescope Imaging Spectrograph, were repaired at the circuit board level. Mission scientists also announced that the Near Infrared Camera and Multi-Object Spectrometer have been brought back into operation during three months of calibration and testing.

Right: Hubble's newly repaired Space Telescope Imaging Spectrograph (STIS) has revealed a stream of charged particles emerging from doomed star Eta Carina. [
more]

http://imgsrc.hubblesite.org/hu/db/images/hs-2009-25-av-small_web.jpg

"On this mission we wanted to replenish the 'tool kit' of Hubble instruments on which scientists around the world rely to carry out their cutting-edge research," said David Leckrone, senior project scientist for Hubble at NASA's Goddard Space Flight Center in Greenbelt, Md. "Prior to this servicing mission, we had only three unique instrument channels still working, and today we have 13. I'm very proud to be able to say, 'mission accomplished.' "

Hubble now enters a phase of full science observations. The demand for observing time will be intense. Observations will range from studying the population of Kuiper Belt objects at the fringe of our solar system to surveying the birth of planets around other stars and probing the composition and structure of extrasolar planet atmospheres. There are ambitious plans to take the deepest-ever near-infrared portrait of the universe to reveal never-before-seen infant galaxies that existed when the universe was less than 500 million years old. Other planned observations will attempt to shed light on the behavior of dark energy, a repulsive force that is pushing the universe apart at an ever-faster rate.

Hubble is back and better than ever. Let the observing begin!

For images and more information about the Hubble Space Telescope, visit

http://www.nasa.gov/hubble

Tuesday, September 1, 2009

Space Debris Tamed


The problem has been quantized better and we have doable project that is able to harvest the objects that are in fact critical or I at least assume so. This suggests that objects not in this mix are at least survivable. Otherwise it is a good plan and puts hardware in orbit able to act as the local fire department

This is certainly a better scenario than previously espoused and based on little good data. A solution is available and it is cost effective. Loses of inaction will exceed that of implementation and if that is true then a common program needs to be put to work perhaps paid for on a per pound recovery charge so no one can squabble over whose fault.

I suspect that it will take some time for all this to be made to happen but the ability to charge back to the source programs will bring interest levels up. The problem is measurable and users can calculate their liability. This at least makes it a sufficiently solvable problem.

Debris - Problem Solved

http://www.spacedaily.com/reports/Space_Debris_Problem_Solved_999.html

Although space debris proliferation presents a long-term challenge that will require a long-term solution, the immediate problem is quite bounded. A study of debris distribution reveals the near-term troubled zone to be a spherically symmetric region between the altitudes of 700 km and 900 km.

by Launchspace Staff

Bethesda MD (SPX) Aug 31, 2009
There is no doubt that the topic of "space debris" is hot! It is a hot subject at
NASA, DARPA, Air Force Space Command, ESA and in the board rooms of all commercial satellite operators. High anxiety is running rampant among these groups. Every debris mitigation technique has been reviewed and pursued. New satellites must have the ability to either de-orbit or move out of the way at end-of-mission.

Upper stages must vent tanks to rid them of residual propellant that might later result in explosions. Many satellites are maneuvered to avoid close-conjunction events. JSpOC is beefing up its satellite and debris tracking capabilities. National and international working groups are meeting regularly to assess the threat and to recommend actions for all space-faring nations. The world is just one major satellite collision event away from panic.

Instances of close conjunction events in highly congested orbital bands have increased dramatically in the past few years. In fact, the frequency of close encounters between active satellites and large debris objects within the Iridium constellation has reached a frighteningly high level. Odds are that there will be another Iridium/Cosmos type of event in the near future.

Should such an event occur, several bad things will happen to many satellite operators. If another Iridium satellite is involved the company would be forced to replace the lost satellite. The frequency of close encounters in orbits near that of Iridium's constellation would suddenly increase to levels that would cause several operators to reassess the viability of existing space applications.

Satellite insurance providers might be forced to raise premiums on in-orbit performance to record high levels. Future launch plans for almost all low orbit satellites may be curtailed. Space-based services to the world would diminish over time. The economic impact is not even calculable. This is scary!

Not to fear. A solution is on the way.

Although space debris proliferation presents a long-term challenge that will require a long-term solution, the immediate problem is quite bounded. A study of debris distribution reveals the near-term troubled zone to be a spherically symmetric region between the altitudes of 700 km and 900 km.

This is where a great many operational satellites and large debris objects co-exist. Thus, the near-term challenge appears to be the removal of enough large debris objects in order to reduce collision risks to levels consistent with statistical times-between-debris-collisions that are much higher than expected satellite mission lifetimes.

Sounds simple, but it is not! Seems impossible, but it is not! So, what will it take to do the job?

Simply stated, all affected parties must collaborate and contribute to create a massive new space effort. There are literally well over 1,000 large debris objects that pose an immediate threat. Every one of these can be removed, and there are a number of removal techniques. One approach, as an example, would be to develop specially designed "Debris Collection Spacecraft."

Each DCS would be capable of maneuvering and rendezvousing with several objects, one at a time. Each object may be stored for later de-orbit, or fitted with an autonomous de-orbit unit that slows the object's orbital speed. If each DCS can deal with 100 objects, assuming only 1,000 objects need to be removed, the job will require 10 DCSs. This whole removal operation must be transparent to commercial, civil and security satellite operators.

In order to be effective, the removal program needs to start yesterday, because it will take several years before actual removal operations can begin. We don't have a lot of time here. If each of 100 objects being collected by one DCS takes three days of maneuvering to reach, then each DCS would require roughly 10 months to achieve its mission. However, it is likely that the DCSs will require in-orbit refueling after each 10 rendezvous completions.

The total mission span for each DCS seems to be roughly one year. If the program is started immediately, it could be completed in about five or six years. The program cost is estimated at $3 billion, based on developing the DCS, on-orbit refueling vehicles and operations, building 10 DCSs and one to two years of ground operations. This is cheap compared to the cost of not doing it.

For all those who are concerned and interested in the space debris crisis, your first step is to get smart on the issues and possible solutions. This is where Launchspace can help. If you are involved in space flight or want to better understand the new space crisis, you will want to sign up for the "must take" seminar on the subject, October 27th in Washington, DC.

Monday, August 17, 2009

Lunar Rock Oxygen


I thought that someone would have gotten serious about this a long time ago. Anyway, what is described is simple brute force methods. I sort of prefer a electrolytic system that does give of CO2 first because that is easily passed into a life supporting environment that can actively produce atmospheric oxygen and avoid a need for exotic chemical systems. Life is already there and has all the built in buffers.

In the event, provided we arrive on the moon or anywhere else in some form of efficient manner that supports a long term stay, then cheap power will be our most available raw material. We would have little reason to be there otherwise.

Cheap power can produce any element to hand sooner or later, even if it is a byproduct. Thus elemental oxygen is certainly an option. It also indcates that space exploration will have to wait for cheap light fusion power produced by a devise similar to that of Focus Fusion.

Only a few metals are legitimately concentrated in space, making beneficiation a difficult trick. Cheap power opens the door to lifting material out of the gravity well of Earth or any other natural concentrator tricky as that might be. Once we have cheap power and large enough magnetic bubble craft, mass lifting should be possible to support space construction.

It is also easily forgotten that mineral beneficiation is actually quite dependent on gravity on Earth. Most material that is rich usually has a significant specific gravity allowing some form of mass enrichment as a first simple step. It is only then that we reach for chemicals and energy.

PhysOrg.com) -- If humans ever create a lunar base, one of the biggest challenges will be figuring out how to breathe. Transporting oxygen to the moon is extremely expensive, so for the past several years NASA has been looking into other possibilities. One idea is extracting oxygen from moon rock.


http://www.physorg.com/news169216598.html#top

Recently, Derek Fray, a materials chemist from the University of Cambridge, and his colleagues have built a reactor that uses oxides in Moon rocks as the cathode in an
electrochemical process to produce oxygen.

The design is based on a process that the researchers invented in 2000 that produces carbon dioxide. In this design, the scientists pass a current between the cathode and an anode made of carbon, with both electrodes sitting in an electrolyte solution of molten calcium chloride, a common salt. The current removes oxygen atoms from the cathode, which are then ionized and dissolve in the molten salt. The negatively charged oxygen is attracted to the carbon anode, where it erodes the anode and produces carbon dioxide.

To produce oxygen rather than
carbon dioxide, the researchers made an unreactive anode using a mixture of calcium titanate and calcium ruthenate instead of the carbon. Because this anode barely erodes, the reaction between the oxygen ions and anode produces oxygen.

Based on experiments with a simulated lunar rock developed by NASA, the researchers calculate that three one-meter-tall reactors could generate one tonne of oxygen per year on the Moon. Each tonne of oxygen would require three tonnes of rock to produce. Fray noted that three reactors would require about 4.5 kilowatts of power, which could be supplied by solar panels or possibly a small
nuclear reactor on the Moon. The researchers are also working with the European Space Agency on developing an even larger reactor that could be operated remotely.


As a recent story in Nature News reports, other researchers are also developing methods for oxygen extraction. For instance, Donald Sadoway at MIT is working on a high-temperature technique called molten salt electrolysis. Here, the Moon rock is molten and acts as the electrolyte itself. Sadoway's reactor could even be built out of the rubble on the Moon's surface called regolith.

NASA and the ESA are strongly encouraging this type of research. In 2008, NASA boosted its $250,000 prize to $1 million for the first team to demonstrate a method to extract five kilograms of
oxygen in eight hours from simulated Moon rock. So far, the prize remains unclaimed.

Tuesday, July 28, 2009

Polar Bears and 2012

I find it very hard to get too exercised over the fate of the polar bears when by all calculations; their populations are at a peak. The only place they are under pressure, and quite frankly, it is pressure to go back further north where the season is clearly longer, is the bottom of Hudson Bay. If they simply developed a habit of migrating north in the spring they would be in great shape.

If anything, an expansion of their food stocks has likely expanded the population and as the ice disappears further, I expect that seal stocks will increase further supporting more bears.

There is presently conversation saying that the areal extent of this summer’s sea ice will not approach that of 2007. True so far as that goes. The wind has not returned and the ice pack is not concentrating. The ice itself is continuing to get thinner and thinner with each passing year. The downward collapse spiral is well entrenched and becoming more obvious. My prediction in 2007 for clear seas of sorts for 2012 is looking better every month.

It may well take 2007 type winds to actually clear these seas in 2012 or sooner. I think now that some new winter ice may last about two years as it rotates through the Arctic Gyre. In the meantime, three year and older is essentially getting eaten up if much is now left at all. In fact, that is perhaps the important question that needs to be asked. NASA has an expedition out there this summer and I am quite sure they are trying to map the real present extent of multi year ice.

If most multi year ice disappears by 2012, then sea ice coverage will consist of fairly thin one and two year ice that will be vulnerable to any decent wind system, even though it may still provide a sea ice cover as erratic as that presently in the Bay. The chances are that this can still provide huge tracts of open water in late August in most years throughout the high Arctic.

Thin ice for arctic beasts

Last Updated: July 23. 2009 3:04PM UAE / July 23. 2009 11:04AM GMT

http://www.thenational.ae/apps/pbcs.dll/article?AID=/20090725/MAGAZINE/707249922/-1/NEWS

The world’s largest land-based hunters, polar bears stand on the edge of rapid decline, unable to adapt quickly to a shrinking habitat as Arctic sea ice melts. Last year the US government added the animal to its threatened species list, but Tim Skelton examines whether it’s too little too late.

Images of starving polar bears are a poignant symbol of the state of our planet. When, in May 2008, the US government added the animal to its threatened species list, it became the first large mammal recognised as being in decline as a result of global warming. Polar bears have a major problem. Their habitat is changing fast, and it’s threatening their survival. Moreover, it won’t just be the bears that are affected. As the Arctic region’s top predator, their disappearance would have an impact on the entire food chain.

The world’s largest land-based hunters, adult male bears can weigh 750kg. They are perfectly adapted to cold climates, with fur designed to trap heat, and furry feet giving good grip on ice. They spend winters on the Arctic sea ice, and are expert seal hunters. But summers are a different story. When the ice melts they spend their time on land fasting, shedding a kilogram a day.This unusual fast/feast cycle worked well until global warming upset the balance. In summer 2007, satellite images revealed that Arctic sea ice retreated to a record level many climatologists had predicted would not happen until 2050. A US Geological Survey report concluded that two-thirds of the polar bear’s habitat could disappear by 2050. And some experts believe sea ice may have passed a point of no return, and may disappear entirely during the summer within 25 years.

Researchers from NASA and the Canadian Wildlife Service have also published a study on the extent of sea ice since 1978. Focussing on Canada’s western Hudson Bay region, they found the ice there was breaking up earlier and earlier, shortening the polar bears’ hunting season by three weeks. “If they feed for a shorter time, they’re going to accumulate less fat,” said Ian Stirling, a polar bear expert with the Canadian Wildlife Service, and co-author of the study. “At the same time, they’re going to be on land and fasting for longer.”

The bears have few food options on land, and must scavenge for whatever they can find. “There are a few sources of nutrition, but not enough to sustain the population,” Stirling said. The lack of food has even forced some animals to resort to cannibalism.Another effect of diminishing ice is that bears must swim longer distances across open water, further depleting their energy. This has led to an increase in cases of drowning. Moreover, as females become thinner, their reproductive rates drop and the survival chances of their cubs declines. The average weight of female bears dropped from 290kg in 1980 to 230kg in 2004.

The global population of polar bears has actually doubled since 40 years ago. Widespread hunting had driven numbers to a low of 12,000 in the 1960s, and a rebound occurred when strict controls were introduced. Today the global population is thought to be 20,000 to 25,000.But this apparently good news is hugely misleading. Virtually all experts agree a time bomb is ticking, and a rapid decline is imminent. With the Arctic warming faster than anywhere else on the planet, the bear’s natural habitat is changing too quickly for them to adapt.

Significant falls in local populations have already been observed. Numbers in the western Hudson Bay region declined from 1,200 in 1987 to 950 in 2004, a 22% drop. Unfortunately, because hungry bears congregate around human settlements in the hope of scavenging for food, native Inuit hunters actually see more bears than they used to. Some treat this as evidence the population is growing.Overall, the US Geological Survey predicts two-thirds of the world’s polar bear population will disappear by 2050, vanishing from all but their most northerly ranges. By 2080, there may only be a few remaining. The US government’s decision to list the bear as “threatened” is a step in the right direction. But it may be too late.

The future doesn’t look bright. But the polar bears’ one remaining trump card may well be their appearance. Despite their ferocious nature, we perceive them as “cute”. When we see them on TV, we sit up and take notice. So with documentary films such as Earth bringing the animal’s suffering right into our living rooms, their plight has become impossible to ignore. For thousands of years, polar bears have been an integral part of the Arctic. If they are going to be around for another thousand, it’s time to act now.

Friday, July 10, 2009

Arctic Sea Ice Collapse Beginning

For some reason this is my week for sea ice. This report is additional confirmation of the present rapidity of the ice loss. They still talk of averages which misleads. Understanding that the ice reduction is best modeled on the basis of a constant size withdrawal, you get an accelerating effect that is now beginning to be very noticeable.

Simple calculation led me to project clear summer seas as early as 2012 back in 2007. NASA woke up and followed suit a few months later. We were all ignored since the press is never going to understand a non linear behavior.

Any way if the average loss has been seven inches a year over the past four years, then the present decline rate is likely around nine inches for this year. Figure ten or so next year and a foot thereafter and we are ice free in 2012. We simply do not have enough multi year ice left to make an iota of difference.

After all the ice has been cleared, we will see a new regime in which winter ice will go through a spring breakup and a swift removal that could be complete as early as mid July. This would provide a comfortable two month sailing season over the top.
Present indications suggest that we are in fact on our way to possibly losing all our multi year sea ice within the next five years. This report and others tell us we can not waffle anymore. In fact this report waffles by not pointing out that this loss is huge by any comparison.

Satellite survey reveals dramatic Arctic sea-ice thinning

http://environmentalresearchweb.org/cws/article/yournews/39779

Scientists have evaluated for the first time how much the thickness and volume of Arctic sea ice, not just the ice's surface area, have shrunk since 2004 across the Arctic Ocean basin. Even where the sea ice cover persists despite climate change in the region, a vast portion of the remaining ice layer has become thinner than it used to be, the new study finds.

"Even in years when the overall extent of sea ice remains stable or grows slightly, the thickness and volume of the ice cover is continuing to decline, making the ice more vulnerable to continued shrinkage," says Ron Kwok, senior research scientist at NASA's Jet Propulsion laboratory in Pasadena, Calif., and leader of the study.

Kwok and colleagues at NASA and the University of Washington, in Seattle, report that Arctic sea ice thinned dramatically between the winters of 2004 and 2008, with thin seasonal ice replacing thick, older ice as the dominant type for the first time on record.

Using ICESat measurements, scientists found that overall Arctic sea ice thinned about 17.8 centimeters (7 inches) a year, for a total of 67 cm (2.2 feet) over four winters. The total area covered by the thicker, older, multi-year ice that survives one or more summers shrank by more than 40 percent.

The team's findings were published today, Tuesday 7 July, in the Journal of Geophysical Research-Oceans, a publication of the American Geophysical Union (AGU). The researchers used measurements from NASA's Ice, Cloud and land Elevation Satellite (ICESat) to generate the first basin-wide estimate of the thickness and volume of the Arctic Ocean's ice cover. The data covers the period from the fall of 2003 through the winter of 2008.

Kwok says the results offer a better understanding of the regional distribution of thick and thin ice in the Arctic, presenting a much more telling picture of what's going on in the Arctic than measurements of how much of the Arctic Ocean is covered in ice alone can.

"Ice volume allows us to calculate annual ice production and gives us an inventory of the freshwater and total ice mass stored in Arctic sea ice," he notes. "Our data will help scientists better understand how fast the volume of Arctic ice is decreasing and how soon we might see a nearly ice-free Arctic in the summer."
The Arctic ice cap grows each winter as the sun sets for several months and intense cold sets in. In the summer, driven by wind and ocean currents, some of that ice naturally flows out of the Arctic, while much of it melts in place. But not all of the Arctic ice thaws each summer: the thicker, older ice is more likely to survive. Seasonal sea ice usually reaches about 1.83 meters (6 feet) in thickness, while multi-year ice averages 2.74 m (9 ft).

In recent years, however, the amount of ice replaced in the winter has not been sufficient to replace summer ice losses. This leads to more open water in summer, which then absorbs more heat, warming the ocean and further melting the ice. Between 2004 and 2008, multi-year ice cover shrank 42 percent, or 1.54 million square kilometers (595,000 square miles) – nearly the size of Alaska's land area.

During the study period, the relative contributions of the two ice types to the total volume of the Arctic's ice cover did a complete flip-flop. In 2003, 62 percent of the Arctic's total ice volume was stored in multi-year ice, with 38 percent stored in first-year seasonal ice. By 2008, 68 percent of the total ice volume was first-year ice, with 32 percent multi-year.

Study co-author and ICESat Project Scientist Jay Zwally of NASA's Goddard Space Flight Center, Greenbelt, Md., says ICESat makes it possible to monitor ice thickness and volume changes over the entire Arctic Ocean for the first time.

"One of the main things that has been missing from information about what is happening with sea ice is comprehensive data about ice thickness," says Zwally. "U.S. Navy submarines provide a long-term, high-resolution record of ice thickness over only parts of the Arctic. The submarine data agree with the ICESat measurements, giving us great confidence in satellites as a way of monitoring thickness across the whole Arctic Basin."

The authors attribute the changes in the overall thickness and volume of Arctic Ocean sea ice to the recent warming and anomalies in patterns of sea ice circulation. "The near-zero replenishment of the multi-year ice cover, combined with unusual exports of ice out of the Arctic after the summers of 2005 and 2007, have both played significant roles in the loss of Arctic sea ice volume over the ICESat record," says Kwok.

Thursday, June 11, 2009

Not So Windy

Not so fast folks. Here again a sketchy bit of data is tagged and allowed inferences that are at best self serving. Do you really think that had the speed increased that it would not also be seen as positive evidence of global warming?

They have discovered that the present set of data collection devices show a range of variance that may justify investigating the placement of the devices and their wind exposure history and significant cultural changes over the past thirty years. Did the trees also grow?

Slowing wind speed, if real, may explain the increase in tornados for example as convection cells have less chance to dissipate.

In the event we are trying to explain variances in huge macroscopic atmospheric flows that also have shown a decadal scale movement whose drivers are not fully understood. Thus my own musings about atmospheric heat masses in order to maintain some perspective in the real scales applied.

The Northern hemisphere did warm up over at least two decades and maintained heat content for another decade and has now begun cooling. Those three simple assertions appear reasonable and uncontroversial. Applying any of that to the detail is instantly controversial.

Not so windy: Research suggests winds dying down

6/10/2009, 5:26 a.m. ET
SETH BORENSTEIN
The Associated Press

http://www.cleveland.com/printer/printer.ssf?/base/national-3/124463459133860.xml&storylist=washington

(AP) — WASHINGTON - The wind, a favorite power source of the green energy movement, seems to be dying down across the United States. And the cause, ironically, may be global warming-the very problem wind power seeks to address.

The idea that winds may be slowing is still a speculative one, and scientists disagree whether that is happening. But a first-of-its-kind study suggests that average and peak wind speeds have been noticeably slowing since 1973, especially in the Midwest and the East.

"It's a very large effect," said study co-author Eugene Takle, a professor of atmospheric science at Iowa State University. In some places in the Midwest, the trend shows a 10 percent drop or more over a decade. That adds up when the average wind speed in the region is about 10 to 12 miles per hour.
There's been a jump in the number of low or no wind days in the Midwest, said the study's lead author, Sara Pryor, an atmospheric scientist at Indiana University.

Wind measurements plotted out on U.S. maps by Pryor show wind speeds falling mostly along and east of the Mississippi River. Some areas that are banking on wind power, such as west Texas and parts of the Northern Plains, do not show winds slowing nearly as much. Yet, states such as Ohio, Indiana, Michigan, Illinois, Kansas, Virginia, Louisiana, Georgia, northern Maine and western Montana show some of the biggest drop in wind speeds.

"The stations bordering the Great Lakes do seem to have experienced the greatest changes," Pryor said Tuesday. That's probably because there's less ice on the lakes and wind speeds faster across ice than it does over water, she said.

Still, the study, which will be published in August in the peer-reviewed Journal of Geophysical Research, is preliminary. There are enough questions that even the authors say it's too early to know if this is a real trend or not. But it raises a new side effect of global warming that hasn't been looked into before.

The ambiguity of the results is due to changes in wind-measuring instruments over the years, according to Pryor. And while actual measurements found diminished winds, some climate computer models-which are not direct observations-did not, she said.

Yet, a couple of earlier studies also found wind reductions in Australia and Europe, offering more comfort that the U.S. findings are real, Pryor and Takle said.

It also makes sense based on how weather and climate work, Takle said. In global warming, the poles warm more and faster than the rest of the globe, and temperature records, especially in the Arctic, show this. That means the temperature difference between the poles and the equator shrinks and with it the difference in air pressure in the two regions. Differences in barometric pressure are a main driver in strong winds. Lower pressure difference means less wind.

Even so, that information doesn't provide the definitive proof that science requires to connect reduced wind speeds to global warming, the authors said. In climate change science, there is a rigorous and specific method-which looks at all possible causes and charts their specific effects-to attribute an effect to global warming. That should be done eventually with wind, scientists say.

Jeff Freedman, an atmospheric scientist with AWS Truewind, an Albany, N.Y., renewable energy consulting firm, has studied the same topic, but hasn't published in a scientific journal yet. He said his research has found no definitive trend of reduced surface wind speed.

One of the problems Pryor acknowledges with her study is that over many years, changing conditions near wind-measuring devices can skew data. If trees grow or buildings are erected near wind gauges, that could reduce speed measurements.

Several outside experts mostly agree that there are signs that wind speed is decreasing and that global warming is the likely culprit.

The new study "demonstrates, rather conclusively in my mind, that average and peak wind speeds have decreased over the U.S. in recent decades," said Michael Mann, director of the Earth System Science Center at Penn State University.

A naysayer is Gavin Schmidt, a NASA climate scientist in New York who said the results conflict with climate models that show no effect from global warming. He also doubts that any decline in the winds that might be occurring has much of an effect on wind power.

But another expert, Jonathan Miles, of James Madison University, said a 10 percent reduction in wind speeds over a decade "would have an enormous effect on power production."

Pryor said a 10 percent change in peak winds would translate into a 30 percent change in how much energy is reaped. But because the research is in such early stages, she said, "at this point it would be premature to modify wind energy development plans."

Robert Gramlich, policy director at the American Wind Energy Association, said the idea of reduced winds was new to him. He wants to see verification from other studies before he worries too much about it.

Friday, May 1, 2009

Active Mercury Magnetosphere

The space exploration part of NASA’s mandate has never been more stimulating and fruitful. Mercury looks like a real planet and quite able to eventually allow us to host an exploration base with appropriate protection.

The models of the planet’s magnetosphere are worth bringing up to look at.

Again, the mapping of magnetic fields is continuing and I would now like to see a program that gets a large number of satellites flying solar polar orbits at varying distances from the sun.

The sun itself must have a huge bow wave out there somewhere as we are traveling at speed toward a rendezvous with Sirius. And since we are apparently not cutting in and out of such a wave, it is clearly larger than earth orbit by a great deal.

Right now we are only getting the two dimensions represented by the plane of the elliptic produced by the planetary orbits or to be a bit more precise that created by the orbit of Jupiter that the rest must adjust to.

In view of our conjecture regarding the eminent importance of magnetic fields for space travel, detailed mapping of these fields and eventually their range of variation is likely to turn out very important to us.

04.30.2009
Active Mercury

April 30, 2009: A NASA spacecraft gliding over the surface of Mercury has revealed that the planet's atmosphere, magnetosphere, and its geological past display greater levels of activity than scientists first suspected. The probe also discovered a large impact basin named "Rembrandt" measuring about 430 miles in diameter -- equal to the distance between Washington and Boston.

These new findings and more are reported in four papers published in the May 1 issue of Science magazine. The data come from the Mercury Surface, Space Environment, Geochemistry, and Ranging spacecraft--MESSENGER for short. On Oct. 6, 2008, MESSENGER flew by Mercury for the second time, capturing more than 1,200 high-resolution and color images of the planet.

"This second Mercury flyby provided a number of new findings," said Sean Solomon, the probe's principal investigator from the Carnegie Institution of Washington. "One of the biggest surprises was how strongly [Mercury's magnetosphere] had changed from what we saw during the first flyby in January 2008."

The magnetosphere is a region of space around Mercury enveloped by the planet's magnetic field. Gusty solar wind pressing against the bubble of magnetism can potentially trigger magnetic storms and other space weather-related phenomena.

"During the first flyby, MESSENGER measured relatively calm dipole-like magnetic fields close to the planet. Scientists didn't detect any dynamic features other than some Kelvin-Helmholtz waves," said James Slavin of NASA's Goddard Space Flight Center. Slavin is a mission co-investigator and lead author of one of the papers.

But the second flyby was a totally different situation," he says. MESSENGER observed a highly dynamic magnetosphere with "magnetic reconnection" events taking place at a rate 10 times greater than what is observed the Earth during its most active intervals.

"The high rate of solar wind energy input was evident in the great amplitude of the plasma waves and the large magnetic structures measured by the spacecraft's magnetometer throughout the encounter."

http://science.nasa.gov/headlines/y2009/images/mercury/mercmag.jpg


Above: An artist's concept of Mercury's surprisingly active magnetosphere. Credits: Image produced by NASA/Goddard Space Flight Center/Johns Hopkins University Applied Physics Laboratory//Carnegie Institution of Washington. Image reproduced courtesy of Science/AAAS. [
more]


Another exciting result is the discovery of a previously unknown large impact basin. The Rembrandt basin is more than 700 kilometers (430 miles) in diameter and if formed on the east coast of the United States would span the distance between Washington, D.C., and Boston.

Rembrandt formed about 3.9 billion years ago, near the end of the period of heavy bombardment of the inner Solar System, suggests MESSENGER Participating Scientist Thomas Watters, lead author of another of the papers. Rembrandt is significant, not only because it is big, but also because it is giving researchers a peek beneath the surface of Mercury that other basins have not.

"This is the first time we've seen terrain exposed on the floor of an impact basin on Mercury that is preserved from when it formed," explains Watters. "Landforms such as those revealed on the floor of Rembrandt are usually completely buried by volcanic flows."

Half of Mercury was unknown until a little more than a year ago. Globes of the planet were blank on one side. Spacecraft images have since revealed 90 percent of the planet's surface at high resolution. This near-global coverage is showing, for the first time, how Mercury's crust was formed.

"After mapping the surface, we see that approximately 40 percent is covered by smooth plains," said Brett Denevi of Arizona State University in Tempe, a team member and lead author of a paper. "Many of these smooth plains are interpreted to be of volcanic origin, and they are globally distributed. Much of Mercury's crust may have formed through repeated volcanic eruptions in a manner more similar to the crust of Mars than to that of the moon."

Another finding of the flyby is the first detection of magnesium in Mercury's exosphere. The exosphere is an ultrathin atmosphere where the molecules are so far apart they are more likely to collide with the surface than with each other. Material in the exosphere comes mainly from the surface of Mercury itself, knocked aloft by solar radiation, solar wind bombardment and meteoroid vaporization:
The probe's Mercury Atmospheric and Surface Composition Spectrometer instrument detected the magnesium. Finding magnesium was not surprising to scientists, but the abundance was unexpected. The instrument also measured other exospheric constituents including calcium and sodium. Researchers believe that big day-to-day changes in Mercury's atmosphere may be caused by the variable shielding of Mercury's active magnetosphere.

"This is an example of the kind of individual discoveries that the science team will piece together to give us a new picture of how the planet formed and evolved," said William McClintock of the Laboratory for Atmospheric and Space Physics at the University of Colorado at Boulder. McClintock co-investigator and lead author of one of the four papers.

"The third Mercury flyby is our final dress rehearsal for the main performance of our mission, the insertion of the probe into orbit around Mercury in March 2011," said Solomon. "The orbital phase will be like staging two flybys per day and will provide the continuous collection of information about the planet and its environment for one year."

"Mercury has been coy in revealing its secrets slowly so far, but in less than two years the innermost planet will become a close friend."

Wednesday, April 15, 2009

Solar Croissants

Even NASA could not resist the obvious lead line. We are actually beginning to map the ‘fine structure’ of the solar system and we are making rather exciting and unexpected discoveries. The stuff we are seeing is dramatic in space but it appears that the planets are well up to brushing all this activity aside. Think of it as an expanded view of the northern lights. We all know that it will not affect anyone but the show is great.

In the end we will end up mapping the magnetism throughout the solar system because it will matter in terms of eventual navigation that takes advantage of magnetic field strength. See my article on the reverse engineering of the UFO.

Anyway, do run the NASA movie showing the croissant forming. At least it isn’t smoke rings.

The Surprising Shape of Solar Storms

April 14, 2009: This just in: The Sun is blasting the solar system with croissants.

Researchers studying data from NASA's twin STEREO probes have found that ferocious solar storms called CMEs (coronal mass ejections) are shaped like a French pastry. The elegance and simplicity of the new "croissant model" is expected to dramatically improve forecasts of severe space weather.

"We believe we can now predict when a CME will hit Earth with only 3-hours of uncertainty," says Angelos Vourlidas of the Naval Research Lab, who helped develop the model. "That's a four-fold improvement over older methods."

Coronal mass ejections are billion-ton clouds of hot magnetized gas that explode away from the sun at speeds topping a million mph. Sometimes the clouds make a beeline for Earth and when they hit they can cause geomagnetic storms, satellite outages, auroras, and power blackouts. The ability to predict the speed and trajectory of a CME is key to space weather forecasting.

"This is an important advance," says Lika Guhathakurta, STEREO program scientist at NASA headquarters in Washington DC. "From a distance, CMEs appear to be a complicated and varied population.

What we have discovered is that they are not so varied after all. Almost all of the 40-plus CMEs we have studied so far with STEREO have a common shape--akin to a croissant."

Thousands of CMEs have been observed by NASA and European Space Agency spacecraft, but until now their common shape was unknown. That's because in the past observations were made from only a single point of view. The STEREO mission has the advantage of numbers. It consists of two probes that flank the sun and photograph explosions from opposite sides. STEREO's sensitive wide-field cameras can track CMEs over a wider area of sky than any other spacecraft, following the progress of the storm all the way from the sun to the orbit of Earth.

"STEREO has done what no previous mission could," notes Guhathakurta.

Vourlidas says he is not surprised that CMEs resemble French pastries. "I have suspected this all along. The croissant shape is a natural result of twisted magnetic fields on the sun and is predicted by a majority of theoretical models."

He offers the following analogy: Take a length of rope and hold one end in each hand. Start twisting the ends in opposite directions. Twist, twist and continue twisting until the middle of the rope is a fat knotted mess.

"That's how CMEs get started—as twisted ropes of solar magnetism. When the energy in the twist reaches some threshold, there is an explosion which expels the CME away from the sun. It looks like a croissant because the twisted ropes are fat in the middle and thin on the ends."


http://science.nasa.gov/headlines/y2009/images/3dcme/avourlidas_vid_03.mov
Right: A computer model of a croissant-shaped CME. Models like this can be rapidly fit to real CMEs as soon as they are observed, allowing forecasters to accurately estimate the speed and trajectory of the storms: movie. Credit: NASA.
The shape alone, however, does not tell the full story of a CME. The contents of the CME must be considered, too. How much plasma does it contain? What is the orientation and strength of its internal magnetic field? When a CME strikes, the havoc it causes will depend on the answers—answers the croissant model does not yet provide.
"There is more work to do. We must learn to look at a CME and not only trace its shape, but also inventory in contents," says Guhathakurta. "We are halfway there."
Eventually, the quest to learn what lies inside the croissant will be taken up by other spacecraft such as the Solar Dynamics Observatory, slated to launch in August 2009, and Solar Probe+, a daring mission (still on the drawing board) to fly close to the sun and actually enter these storms near their source.
STEREO isn't finished, though. The two probes are continuing their journeys to opposite sides of the sun for a 24/7, 360-degree view of the star. Along the way, they'll actually run into a few CMEs and have the chance to sample the 'croissants' in situ.
Stay tuned for updates.

Monday, March 2, 2009

Dr. Hansen Over the Top

Dr Hansen’s utterances have recently gone way over the edge into the land of fanaticism and faith based positions and certainly is not the voice of science. His colleagues are quite right to call him out on this and he would be quite right to back of and apologize.

Of course Mother Nature has called him on the weakness of his science and his explanations have collapsed with each passing month of really lousy weather as he finds himself supporting the unsupportable.

The global temperature needs to rebound and we have seen no evidence of that this winter. It was worse than last winter, and I think that we are going to have a good growing season this year across North America.

Oh well, he probably thinks he is important enough to challenge someone who will bite his head off.

NASA's Chief Climate Scientist Stirs Controversy with Call for Civil Disobedience

Thursday, February 26, 2009
By Joshua Rhett Miller

Dr. James Hansen at a Capitol Hill press conference in 2008.

NASA's chief climate scientist is in hot water with colleagues and at least one lawmaker after calling on citizens to engage in civil disobedience at what is being billed as the largest public protest of global warming ever in the United States.

In a video on
capitolclimateaction.org, Dr. James Hansen is seen urging Americans to "take a stand on global warming" during the March 2 protest at the Capitol Power Plant in Southeast Washington, D.C.

"We need to send a message to Congress and the president that we want them to take the actions that are needed to preserve climate for young people and future generations and all life on the planet," says Hansen, who has likened coal-fired power plants to "factories of death" and claims he was muzzled by the Bush administration when he warned of drastic climate changes.

"What has become clear from the science is that we cannot burn all of the fossil fuels without creating a very different planet. The only practical way to solve the problem is to phase out the biggest source of carbon — and that's coal."

var adsonar_placementId="1426008",adsonar_pid="256757",adsonar_ps="-1",adsonar_zw=224;adsonar_zh=93,adsonar_jv="ads.adsonar.com";
qas_writeAd()
;

But critics say Hansen's
latest call to action blurs the line between astronomer and activist and may violate the Hatch Act, which prohibits federal employees from participating in partisan political activity.

"Oh my goodness," one of Hansen's former supervisors, Dr. John Theon, told FOXNews.com when informed of the video. "I'm not surprised ... The fact that Jim Hansen has gone off the deep end here is sad because he's a good fellow."

Theon, a former senior NASA atmospheric scientist, rebuked Hansen last month in a letter to the Senate's Environment and Public Works Committee, saying Hansen had violated NASA's official position on climate forecasting without sufficient evidence and embarrassed the agency by airing his claims before Congress in 1988.

"Why he has not been fired I do not understand," Theon said. "As a civil servant, you can't participate in calling for a public demonstration. You may be able to participate as a private citizen, but when you go on the Internet and call for people to break the law, that's a problem."

Officials at the U.S. Office of Special Counsel, which investigates possible Hatch Act violations, disagreed, saying Hansen is in the clear since it's an "issue-oriented activity," according to Hatch Unit attorney Erica Stern Hamrick.

The majority of federal government employees are allowed to take an active part in political activities, while workers at other departments like the FBI, Secret Service and National Security Council are subject to more restrictions on their political activities.

NASA spokesman Mark Hess also defended Hansen.

"He's doing this as a private citizen on his own time and there's nothing wrong with that," Hess told FOXNews.com. "There's nothing partisan here. You don't give up your rights to free speech by becoming a government employee."

Matt Leonard, a project coordinator for Greenpeace, one of more than 90 organizations endorsing the protest, said several thousand people are expected to participate and "peacefully disrupt operations" at the plant just blocks from Capitol Hill.

Participants are willing to "put their bodies on the line to stop climate change," including risking arrest, Leonard said.

"Our intention is to completely surround the facility, basically sending a message that these types of power plants can't be a part of our future," Leonard said. "They're destroying our environment."

Hansen will be in attendance and is expected to speak at the "completely nonviolent, peaceful" protest, Leonard said.

Meanwhile, Rep. Dana Rohrabacher, R-Calif., urged Hansen to rethink his plans.

"If he wants to have a demonstration concerning global warming, coming to the Capitol is not a right choice," Rohrabacher told FOXNews.com. "The bottom line is if Hansen wants to protest global warming, he should go to the National Cathedral and take it up with God rather than going to Capitol Hill."

Rohrabacher, a member of the House's Committee on Science and Technology, called on Hansen to "step out" of his role.

"He obviously doesn't feel comfortable with the restraints that come with being a scientist rather than a political activist," Rohrabacher said. "Most of us have always thought he has been hiding behind a scientific facade, and really, he was a political activist all along."

Chris Horner, author of "Red Hot Lies: How Global Warming Alarmists Use Threats, Fraud, and Deception to Keep You Misinformed," also denounced Hansen's latest call to arms against climate change.

"He's providing ample cause to question his employment on the taxpayer dime," Horner told FOXNews.com. "He's clearly abused his platform provided to him by the taxpayer, principally by the way he's been exposed of manipulating and revising
data with the strange coincidence of him always found on the side of exaggerating the warming."

Horner claimed that Hansen doctored temperature data on two occasions in 2001 and once in 2007 in attempts to show an impending climate catastrophe.

"He's creating an upward slope that really wasn't there," Horner said. "At some point you have to say these aren't mistakes."

Hansen, who did not respond to repeated requests for comment on this story, was most recently honored for his work last month with the 2009 Carl-Gustaf Rossby Research Medal, the highest honor bestowed by the American Meteorological Society.

"Jim Hansen is performing a tremendous job at communicating our science to the public and, more importantly, to policymakers and decision-makers," Franco Einaudi, director of the Earth Sciences Division at NASA's Goddard Space Flight Center, said in a press release.

"The debate about global change is often emotional and controversial, and Jim has had the courage to stand up and say what others did not want to hear. He has acquired a credibility that very few scientists have. His success is due in part to his personality, in part to his scientific achievements, and in part to his refusing to sit on the sidelines of the debate."
Former Vice President Al Gore, who toured with Hansen while promoting "An Inconvenient Truth," did not return repeated requests for comment for this article.

Tuesday, February 24, 2009

Comet Lulin Shines Tonight

My chances of spotting comet Lulin went to zero tonight with the advent of a rainstorm eliminating any possible viewing conditions. However, we have this picture from the Swift satellite and the related story to make up for it.

I also noticed from the map log of my readers that there was a lot of interest and that google found my site helping folks locate Lulin from the story I posted some weeks back. By the way this blog is clocking around 400 readers every day which is not bad at all from a blog whose subject matter palette is eccentric to say the least. Anyway it is nice to see a response passing through the readership for an event like this.

I need to pay more attention to events like this and do welcome tips. I am not planning to become a day log of news traffic since there is plenty of that, but I like to catch stuff that I care about sooner than later.

NASA's Swift Spies Comet Lulin

http://www.spacedaily.com/reports/NASA_Swift_Spies_Comet_Lulin_999.html

by Francis Reddy
Pasadena CA (SPX) Feb 24, 2009

http://www.spacedaily.com/images/comet-lulin-libra-swift-dss-bg.jpg


Comet Lulin was passing through the constellation Libra when Swift imaged it. This view merges the Swift data with a Digital Sky Survey image of the star field. Credit: NASA/Swift/Univ. of Leicester/DSS (STScI, AURUA)/Bodewits et al. For a larger version of this image please go
here.

********

While waiting for high-energy outbursts and cosmic explosions, NASA's Swift Gamma-ray Explorer satellite is monitoring Comet Lulin as it closes on Earth. For the first time, astronomers are seeing simultaneous ultraviolet and X-ray images of a comet.

"We won't be able to send a space probe to Comet Lulin, but Swift is giving us some of the information we would get from just such a mission," said Jenny Carter, at the University of Leicester, U.K., who is leading the study.
"The comet is releasing a great amount of gas, which makes it an ideal target for X-ray observations," said Andrew Read, also at Leicester.

A comet is a clump of frozen gases mixed with dust. These "dirty snowballs" cast off gas and dust whenever they venture near the sun. Comet Lulin, which is formally known as C/2007 N3, was discovered last year by astronomers at Taiwan's Lulin Observatory. The comet is now faintly visible from a dark site. Lulin will pass closest to Earth - 38 million miles, or about 160 times farther than the
moon - late on the evening of Feb. 23 for North America.

On Jan. 28, Swift trained its Ultraviolet/Optical Telescope (UVOT) and X-Ray Telescope (XRT) on Comet Lulin. "The comet is quite active," said team member Dennis Bodewits, a NASA Postdoctoral Fellow at the Goddard Space Flight Center in Greenbelt, Md. "The UVOT data show that Lulin was shedding nearly 800 gallons of water each second." That's enough to fill an Olympic-size swimming pool in less than 15 minutes.

Swift can't see water directly. But ultraviolet light from the sun quickly breaks apart water molecules into
hydrogen atoms and hydroxyl (OH) molecules. Swift's UVOT detects the hydroxyl molecules, and its images of Lulin reveal a hydroxyl cloud spanning nearly 250,000 miles, or slightly greater than the distance between Earth and the moon.

The UVOT includes a prism-like device called a grism, which separates incoming light by wavelength. The grism's range includes wavelengths in which the hydroxyl molecule is most active.

"This gives us a unique view into the types and quantities of gas a comet produces, which gives us clues about the origin of comets and the solar system," Bodewits explains. Swift is currently the only space observatory covering this wavelength range.

In the Swift images, the comet's tail extends off to the right. Solar
radiation

pushes icy grains away from the comet. As the grains gradually evaporate, they create a thin hydroxyl tail.

Farther from the comet, even the hydroxyl molecule succumbs to solar ultraviolet radiation. It breaks into its constituent oxygen and hydrogen atoms. "The solar wind - a fast-moving stream of particles from the sun - interacts with the comet's broader cloud of atoms. This causes the solar wind to light up with X rays, and that's what Swift's XRT sees," said Stefan Immler, also at Goddard.

This interaction, called charge exchange, results in X-rays from most comets when they pass within about three times Earth's distance from the sun. Because Lulin is so active, its atomic cloud is especially dense. As a result, the X-ray-emitting region extends far sunward of the comet.

"We are looking forward to future observations of Comet Lulin, when we hope to get better X-ray data to help us determine its makeup," noted Carter. "They will allow us to build up a more complete 3-D picture of the comet during its flight through the
solar system."

Other members of the team include Michael Mumma and Geronimo Villanueva at Goddard.

NASA's Goddard Space Flight Center in Greenbelt, Md., manages the Swift satellite. It is being operated in collaboration with partners in the U.S., the United Kingdom, Italy, Germany and Japan. NASA's Fermi Gamma-ray Space Telescope is an astrophysics and particle physics observatory developed in collaboration with the U.S. Department of Energy and with important contributions from academic institutions and partners in France, Germany, Italy, Japan, Sweden, and the U.S.

Monday, February 2, 2009

Polls turn against Gobal Warming

I am personally disturbed that the Global Warming debate has degenerated into blind propaganda and deliberate intimidation when challenged. Everyone involved is acting more and more desperate and strident, particularly the media crowd who are finding themselves riding a dying horse.

Now we have polls showing that the great unwashed is no longer buying the party line and is getting downright surly.

The Media needs a new story to sell. Global Warming has lost its legs and will not now be back for decades.
Perhaps we are hearing the howls of chagrin as every reporter loses his best excuse for a story spin on any mundane subject. Maybe we can get them back to chasing volcanoes and hurricanes.

It is still remarkable that the unrelenting drum beat of pro global warming material is actually taking support in reverse. A very real lesson for those who wish to shape public opinion is that at some point you begin to work against yourself. This is not obvious, but the harder you work to catch everybody, the more you force your soft support to review their position. And minds thus engaged do change.

This is an interesting curve. As funds expended climb, the support percentage also climbs quite briskly at first, then levels off, and then begins to decline slightly. Obviously, once you hit a peak, it is best to smartly drop expenditures to maintenance levels.

This should apply nicely to advertising campaigns.

By Bob Ellis on January 19th, 2009

Al Gore and his disciples are losing the war to convince the American people that human beings are responsible for any warming of planet earth.

Forty-four percent (44%) of U.S. voters now say long-term planetary trends are the cause of global warming, compared to 41% who blame it on human activity.

This is down from 47% last year, so the Gore-ites are progressively losing their grip on the minds of the people.
This is especially remarkable given that the “mainstream” media has been 110% in the tank for Gore and his outrageous claims for years. They have been totally complicit in pushing this notion despite the fact that there is little science to back it up, and a mountain of
conflicting evidence.

NASA temperature records have been found to be erroneous and have been revised…with little or no fanfare in the “mainstream” media.

Many of the weather stations gathering evidence has also been compromised and do not provide reliable data.

Believers in this theory also ignore evidence going back thousands of years (some say even farther) showing natural climate cycles.

They ignore the most obvious possibility that the huge star in the middle of our solar system (known commonly as “the sun”) may be changing the temperature change on earth. Warming has been detected on
Mars and Jupiter where there are no SUVs or power plants, yet we are expected to believe humans and their capitalistic progress are the villains on this planet.

The “mainstream” media has also attempted to create a perception that there is no dissent in the scientific community to this wacky idea, despite the fact that
thousands of scientists have officially registered their disagreement, and many continually go on record (in the off-the-beaten-path venues where they are allowed to go on record) with their skepticism.

It’s heartening to see the ability of the American people to see through the environmentalist garbage they’re fed from the “mainstream” media and others on the Left.

Too bad that wasn’t the case in the recent election.

Friday, January 30, 2009

Death Throes of Global Warming Hypothesis

A lot of the members of the scientific community are finding they are sorry that they ever signed on to the global warming enthusiasm.

When I began this blog, the fact that the climate had warmed up a degree or so and had then held on to that increase for a decade was obviously true. The idea that this was an event outside the normal range of climatic variation was not obviously true. In fact the apparent cyclic time spans involved supported the idea that this was a natural reoccurrence.

For that reason, from the beginning, I explicitly separated my concerns over the accumulation of CO2 from my ongoing interest in the climate and my principal theme of terraforming the Earth and yes, actually warming up the northern Hemisphere in the process.

History will show that the atmosphere discharged surplus heat into the Arctic in 2007 and thereafter global temperatures fell back abruptly by a degree or so by now. In short, the warmth that took a decade or more to accumulate and sustained for an additional decade, was lost almost overnight. We also have a much better understanding of the mechanism.

In the summer of 2007, we were on the road to an ice free summer Arctic by 2012. Three months later, the switch had been visibly been pulled and we had started on the down slope. That has continued through this winter. We are literally back to the worst of it and are hoping that some nasty volcano does not pick this time to blow its top.

Right now, the folks who should have known better, or were simply too intimidated to speak their minds are now standing up and kicking this dead horse to death.

It will be fun to promote my program for employing two billion people and warming the Earth while the media gets back to promoting the next ice age. Maybe someone will listen.

The turning point—it’s becoming chic to be a skeptic

This must be it, surely, the point where being a skeptic has more scientific cachet than being a believer. The trickle is becoming a flood. We are reaching the stage where independent scientists will want to make sure they are known to be on the skeptical side of the fence.

None other than James Hansen’s former supervisor at NASA has just
announced that not only is he a skeptic, but that Hansen is an embarrassment to NASA and was never muzzled. In a message to the Minority Office at the Environment and Public Works Committee, Theon wrote:

“I appreciate the opportunity to add my name to those who disagree that global warming is man made, …I was, in effect, Hansen’s supervisor because I had to justify his funding, allocate his resources, and evaluate his results”

“Hansen was never muzzled even though he violated NASA’s official agency position on climate forecasting (i.e., we did not know enough to forecast climate change or mankind’s effect on it). Hansen thus embarrassed NASA by coming out with his claims of global warming in 1988 in his testimony before Congress,”

Retired senior NASA atmospheric scientist, Dr. John S. Theon

Theon joins a growing list of over 650 prominent skeptics. Here’s how the list is becoming a story all of it’s own, and the drive to publicly announce skepticism is picking up pace.

Dec 11, 2008: Marc Morano released an updated list of
650 skeptics, it’s a 230 page pdf file with quotes and qualifications listed from skeptical prominent scientists that even includes past and present IPCC authors. As people became aware of the list, the clamour began from those who want to join in. 11 scientists joined the list in the next two weeks including Dr Schaffer, and Dr Happer (below).

Dec 19, 2008: Dr Schaffer, Professor of Ecology & Evolutionary Biology Uni of Arizona, has authored more than 80 scientific publications and authored the paper “Human Population and Carbon Dioxide.”

“The recent lack of warming in the face of continued increases in CO2 suggests (a) that the effects of greenhouse gas forcing have been over-stated; (b) that the import of natural variability has been underestimated and (c) that concomitant rises of atmospheric CO2 and temperature in previous decades may be coincidental rather than causal,” he added. “I fear that things could easily go the other way: that the climate could cool, perhaps significantly; that the consequences of a new Little Ice Age or worse would be catastrophic and that said consequences will be exacerbated if we meanwhile adopt warmist prescriptions. This possibility, plus the law of unintended consequences, leads me to view proposed global engineering ‘solutions’ as madness.”

Dr. W. M. Schaffer, Professor, Uni of Arizona

Dec 22, 2007: Dr Will Happer, Professor at Princeton University and former Director of Energy Research at the Department of Energy from 1990 to 1993, and has published over 200 scientific papers.

“I had the privilege of being
fired by Al Gore, since I refused to go along with his alarmism. I did not need the job that badly… I have spent a long research career studying physics that is closely related to the greenhouse effect, for example, absorption and emission of visible and infrared radiation, and fluid flow… Fears about man-made global warming are unwarranted and are not based on good science.”

Dr Will Happer, Professor, Princeton

January 7th, 2009: Jack Schmitt—the last man to walk on the moon, announced he was a skeptic.

“As a geologist, I love Earth observations,” Schmitt wrote, “But, it is ridiculous to tie this objective to a ‘consensus’ that humans are causing global warming when human experience, geologic data and history, and current cooling can argue otherwise. ‘Consensus,’ as many have said, merely represents the absence of definitive science. You know as well as I, the ‘global warming scare’ is being used as a political tool to increase government control over American lives, incomes and decision making…”

Jack Schmitt, Geology PhD, Harvard, NASA Astronaut

This is probably the sweetest of the lot in a way. As Marc Morano points out,
back in 2006 Al Gore said “The debate’s over. The people who dispute the international consensus on global warming are in the same category now with the people who think the moon landing was staged on a movie lot in Arizona.”

Back then, being a skeptic was supposedly equivalent to being a nut-case. Now, even those who’ve landed on the moon dispute the concensus.

The momentum is growing. History will record this cold northern winter as the season when being known as a skeptic became scientifically hip, and being labelled a ‘believer’—scientifically uncool (as it should be) .

I say: scientists everywhere, be proud of our standards, stand up and be counted. Rise against Dark-Age-reasoning, political pressure and the call of government grants.

Monday, January 26, 2009

Superflare Superthreat

The only good thing about a super flare is that it is brief. This article is a reminder that they really exist. And it will still take a lot of time to recover services, particularly if all the transformers are fried.

Which truly begs the question regarding how well the system is protected? This is not difficult, but certainly costs money. It is surely not impossible to protect transformers in particular and those are the things that take time. Breakers protect cables surely even though most everything else is likely to be fried.

I doubt is any of our computers are protected. So while protecting the grid is a case of avoiding design negligence, the rest of the system needs regulatory standards.

This report is a loud warning that we have not done what common sense tells us to do. We need to pay attention. Why are our transformers and motors not wrapped simply in foil? Or is that just too cheap and brain dead easy? Of course most computers are in metal casings which do most of the job.

However, the mere fact that 130 main transformers are even vulnerable tells me that this issue is not on any design engineer’s radar.

It is simple to put the rules in place to lower exposure and simple obsolescence will resolve it all over twenty years. The only thing that requires immediate attention is the transformer inventory. There we are talking about Hurricane Katrina style negligence

Severe Space Weather

01.21.2009 January 21, 2009: Did you know a solar flare can make your toilet stop working?

That's the surprising conclusion of a NASA-funded study by the National Academy of Sciences entitled Severe Space Weather Events—Understanding Societal and Economic Impacts. In the 132-page report, experts detailed what might happen to our modern, high-tech society in the event of a "super solar flare" followed by an extreme geomagnetic storm. They found that almost nothing is immune from space weather—not even the water in your bathroom.

The problem begins with the electric power grid. "Electric power is modern society's cornerstone technology on which virtually all other infrastructures and services depend," the report notes. Yet it is particularly vulnerable to bad space weather. Ground currents induced during geomagnetic storms can actually melt the copper windings of transformers at the heart of many power distribution systems.
Sprawling power lines act like antennas, picking up the currents and spreading the problem over a wide area. The most famous geomagnetic power outage happened during a space storm in March 1989 when six million people in Quebec lost power for 9 hours: image.

According to the report, power grids may be more vulnerable than ever. The problem is interconnectedness. In recent years, utilities have joined grids together to allow long-distance transmission of low-cost power to areas of sudden demand. On a hot summer day in California, for instance, people in Los Angeles might be running their air conditioners on power routed from Oregon. It makes economic sense—but not necessarily geomagnetic sense. Interconnectedness makes the system susceptible to wide-ranging "cascade failures."

To estimate the scale of such a failure, report co-author John Kappenmann of the Metatech Corporation looked at the great geomagnetic storm of May 1921, which produced ground currents as much as ten times stronger than the 1989 Quebec storm, and modeled its effect on the modern power grid. He found more than 350 transformers at risk of permanent damage and 130 million people without power. The loss of electricity would ripple across the social infrastructure with "water distribution affected within several hours; perishable foods and medications lost in 12-24 hours; loss of heating/air conditioning, sewage disposal, phone service, fuel re-supply and so on."

"The concept of interdependency," the report notes, "is evident in the unavailability of water due to long-term outage of electric power--and the inability to restart an electric generator without water on site."

http://science.nasa.gov/headlines/y2009/images/severespaceweather/collapse.jpg


Above: What if the May 1921 superstorm occurred today? A US map of vulnerable transformers with areas of probable system collapse encircled. A state-by-state map of transformer vulnerability is also available: click here. Credit: National Academy of Sciences.

The strongest geomagnetic storm on record is the Carrington Event of August-September 1859, named after British astronomer Richard Carrington who witnessed the instigating solar flare with his unaided eye while he was projecting an image of the sun on a white screen. Geomagnetic activity triggered by the explosion electrified telegraph lines, shocking technicians and setting their telegraph papers on fire; Northern Lights spread as far south as Cuba and Hawaii; auroras over the Rocky Mountains were so bright, the glow woke campers who began preparing breakfast because they thought it was morning. Best estimates rank the Carrington Event as 50% or more stronger than the superstorm of May 1921.

"A contemporary repetition of the Carrington Event would cause … extensive social and economic disruptions," the report warns. Power outages would be accompanied by radio blackouts and satellite malfunctions; telecommunications, GPS navigation, banking and finance, and transportation would all be affected. Some problems would correct themselves with the fading of the storm: radio and GPS transmissions could come back online fairly quickly. Other problems would be lasting: a burnt-out multi-ton transformer, for instance, can take weeks or months to repair. The total economic impact in the first year alone could reach $2 trillion, some 20 times greater than the costs of a Hurricane Katrina or, to use a timelier example, a few TARPs.

What's the solution? The report ends with a call for infrastructure designed to better withstand geomagnetic disturbances, improved GPS codes and frequencies, and improvements in space weather forecasting. Reliable forecasting is key. If utility and satellite operators know a storm is coming, they can take measures to reduce damage—e.g., disconnecting wires, shielding vulnerable electronics, powering down critical hardware. A few hours without power is better than a few weeks.

NASA has deployed a fleet of spacecraft to study the sun and its eruptions. The Solar and Heliospheric Observatory (SOHO), the twin STEREO probes, ACE, Wind and others are on duty 24/7. NASA physicists use data from these missions to understand the underlying physics of flares and geomagnetic storms; personnel at NOAA's Space Weather Prediction Center use the findings, in turn, to hone their forecasts.
At the moment, no one knows when the next super solar storm will erupt. It could be 100 years away or just 100 days. It's something to think about the next time you flush.